Simulation-Based Comparison of Production Routes
Your "best" foundry route is often just the fastest guess—and in high-stakes casting environments, fast guesses translate directly into scrap, rework, and missed delivery windows. Simulation changes that equation entirely. By running production route comparisons inside a virtual foundry environment, engineers can transform intuition based decisions into measurable, physics-driven predictions—before a single tooling commitment is made.

What We Compare: The Route Differences That Actually Create Defects
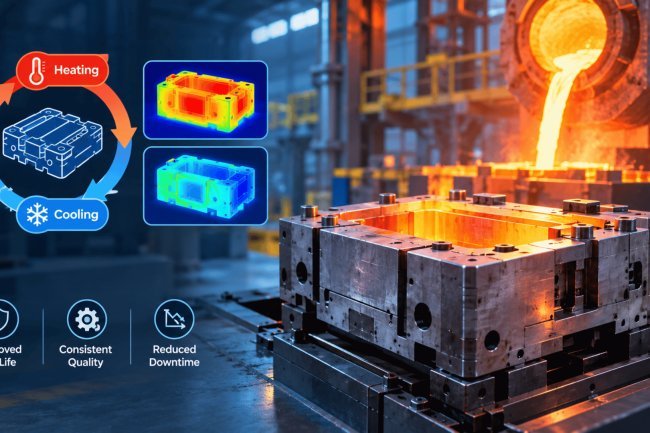
Not all production route differences are visible to the naked eye—but their consequences show up as porosity, misruns, hot tears, and dimensional warpage that fail quality inspection. Simulation makes those invisible physics visible, comparable, and controllable.
Hydrodynamics — Filling & Misrun Risk
PoligonSoft models the fluid dynamics of metal flow during mold filling with high fidelity.
Every gating geometry change alters turbulence patterns, air entrainment probability, and cold-shut formation risk.
Comparing routes means comparing these filling behaviors directly—not estimating them from prior experience or rule-of-thumb heuristics.
Thermal Solidification — Shrinkage Porosity
Solidification sequencing determines where shrinkage porosity forms and how severely.
Different routes change cooling conditions, riser effectiveness, and local freezing rates.
Simulation maps the entire thermal history so engineers can see exactly which route produces a sounder casting—quantitatively, not qualitatively.
Thermo-Mechanical Stress — Hot Tearing & Warpage
Residual stress, hot tearing susceptibility, and final dimensional stability are all functions of the thermo-mechanical loading history a casting experiences.
Each route imposes a different stress signature.
Simulation compares these signatures so dimensional accuracy and structural integrity are evaluated before the die is cut or the mold is built.
The comparison output is never "opinions"—it is physics-based outcomes expressed as evidence-ready engineering metrics: yield percentages, defect prevention indices, and iteration cycle time savings versus physical trial-and-error methods.
Learn more about the Foundry Process Engineering with Simulation Tools workflow that makes this possible.
Not all production route differences are visible to the naked eye—but their consequences show up as porosity, misruns, hot tears, and dimensional warpage that fail quality inspection. Simulation makes those invisible physics visible, comparable, and controllable.
Before any route comparison delivers actionable insight, the simulation environment itself must be rigorous and neutral. That means standardizing mesh resolution, boundary conditions, material property models, and thermal interface definitions so that observed differences between routes reflect genuine engineering performance—not artifacts of inconsistent setup.
Before any route comparison delivers actionable insight, standardize mesh resolution, boundary conditions, material property models, and thermal interface definitions. This ensures that observed differences reflect genuine engineering performance rather than inconsistent setup.
When every route runs through the same controlled virtual environment, the comparison is fair, reproducible, and defensible to engineering leadership, quality teams, and customers who need confidence in the decision rationale.
Once the baseline comparisons are established, sensitivity studies reveal which design parameters most strongly influence key output metrics.
Establish neutral, repeatable environment.
Explore parameter impacts systematically.
Translate results into clear actions.
Sensitivity analysis answers these questions quantitatively.
Does it dominate misrun risk?
Does it matter more for shrinkage control?
How does it influence shrinkage control?
Analytics dashboards then map these performance changes back to the specific design parameters that drive them—converting raw simulation output into prioritized engineering decisions. The result is a structured, root-cause-clear framework that reduces risk before production begins rather than firefighting defects after the fact.
Explore PoligonSoft: Explore how PoligonSoft's simulation platform structures this screening and root-cause workflow for foundry teams.
Building the Case: Simulation-First Screening & Root-Cause Clarity
Standardized Setup: Eliminating Comparison Bias
Standardize the Simulation Setup
Keep Comparisons Fair
Sensitivity Studies & Analytics Dashboards
Standardize Setup
Run Sensitivity Studies
Convert Outputs to Decisions
Which Design Parameters Matter Most?
Gating Cross-Section Area
Riser Placement
Riser Volume
Analytics Dashboards & Root-Cause Clarity
A route that performs perfectly under ideal simulation conditions but fails under normal production variation is not a robust route—it is a fragile one waiting to generate scrap. True route optimization must account for the statistical scatter that every real foundry environment introduces.
Performs perfectly under ideal simulation conditions but fails under normal production variation—waiting to generate scrap.
Optimized for the best distribution of results across the full process window—surviving real-world scatter in temperature, chemistry, coatings, humidity, and operator timing.
Visit the Foundry Process Engineering workflow to see how robustness analysis integrates into route selection.
Robust Routes: Optimization That
Survives Real-World ScatterThe full process variation space.
Rank what matters across the window.
"How bad can this get when conditions drift?"
migrating risk from the shop floor to the virtual design office,
where it costs computation time rather than scrap metal and rework labor.
Documented in IIoT/AI-integrated foundry case study combining real-time sensor data with simulation optimization loops.
Achieved by combining real-time production data feedback with simulation-driven process optimization in an advanced autonomous engineering program.
Autonomous DoE plus surrogate model frameworks run hundreds of virtual trials simultaneously—each calibrating the next toward a robust optimum.
These results are not theoretical projections—they are measured production outcomes from foundries that committed to simulation-driven route selection and closed-loop optimization. The mechanism behind them is the autonomous learning loop: Design of Experiments (DoE) generates a structured exploration of the design space, surrogate models accelerate the search by predicting outcomes without running full simulations at every point, and each completed experiment calibrates the surrogate's accuracy until a robust optimum stabilizes. Dozens or hundreds of route variations are evaluated in the time it previously took to run a single physical trial.
Simulation-based route comparison is not a one-time engineering exercise—it is a continuously improving capability. As more route data accumulates, surrogate models become more accurate, process windows become better understood, and the organization builds institutional knowledge that survives personnel changes.
Every new casting project benefits from every previous one.
The competitive advantage compounds: faster development cycles, fewer qualification failures, lower scrap targets, and engineering teams freed from reactive firefighting to focus on proactive innovation.
The workflow described across this presentation—from standardized route screening through robustness optimization to autonomous learning loops—is operational today within the PoligonSoft simulation environment.
To understand the complete software capability and how it applies to your specific alloy systems, casting geometries, and production challenges, explore PoligonSoft zero-defect foundry simulation and review the detailed Foundry Process Engineering with Simulation Tools methodology.
The shift from trial-and-error to predictive certainty begins with a single comparative simulation run.
Conclusion: Autonomous Learning Loops That Reduce Scrap & Accelerate Improvement
Scrap Reduction
Scrap-Rate Cut
Parallel Experiments
From Virtual Comparison to Production Confidence
Explore the Full Capability
What's Your Reaction?